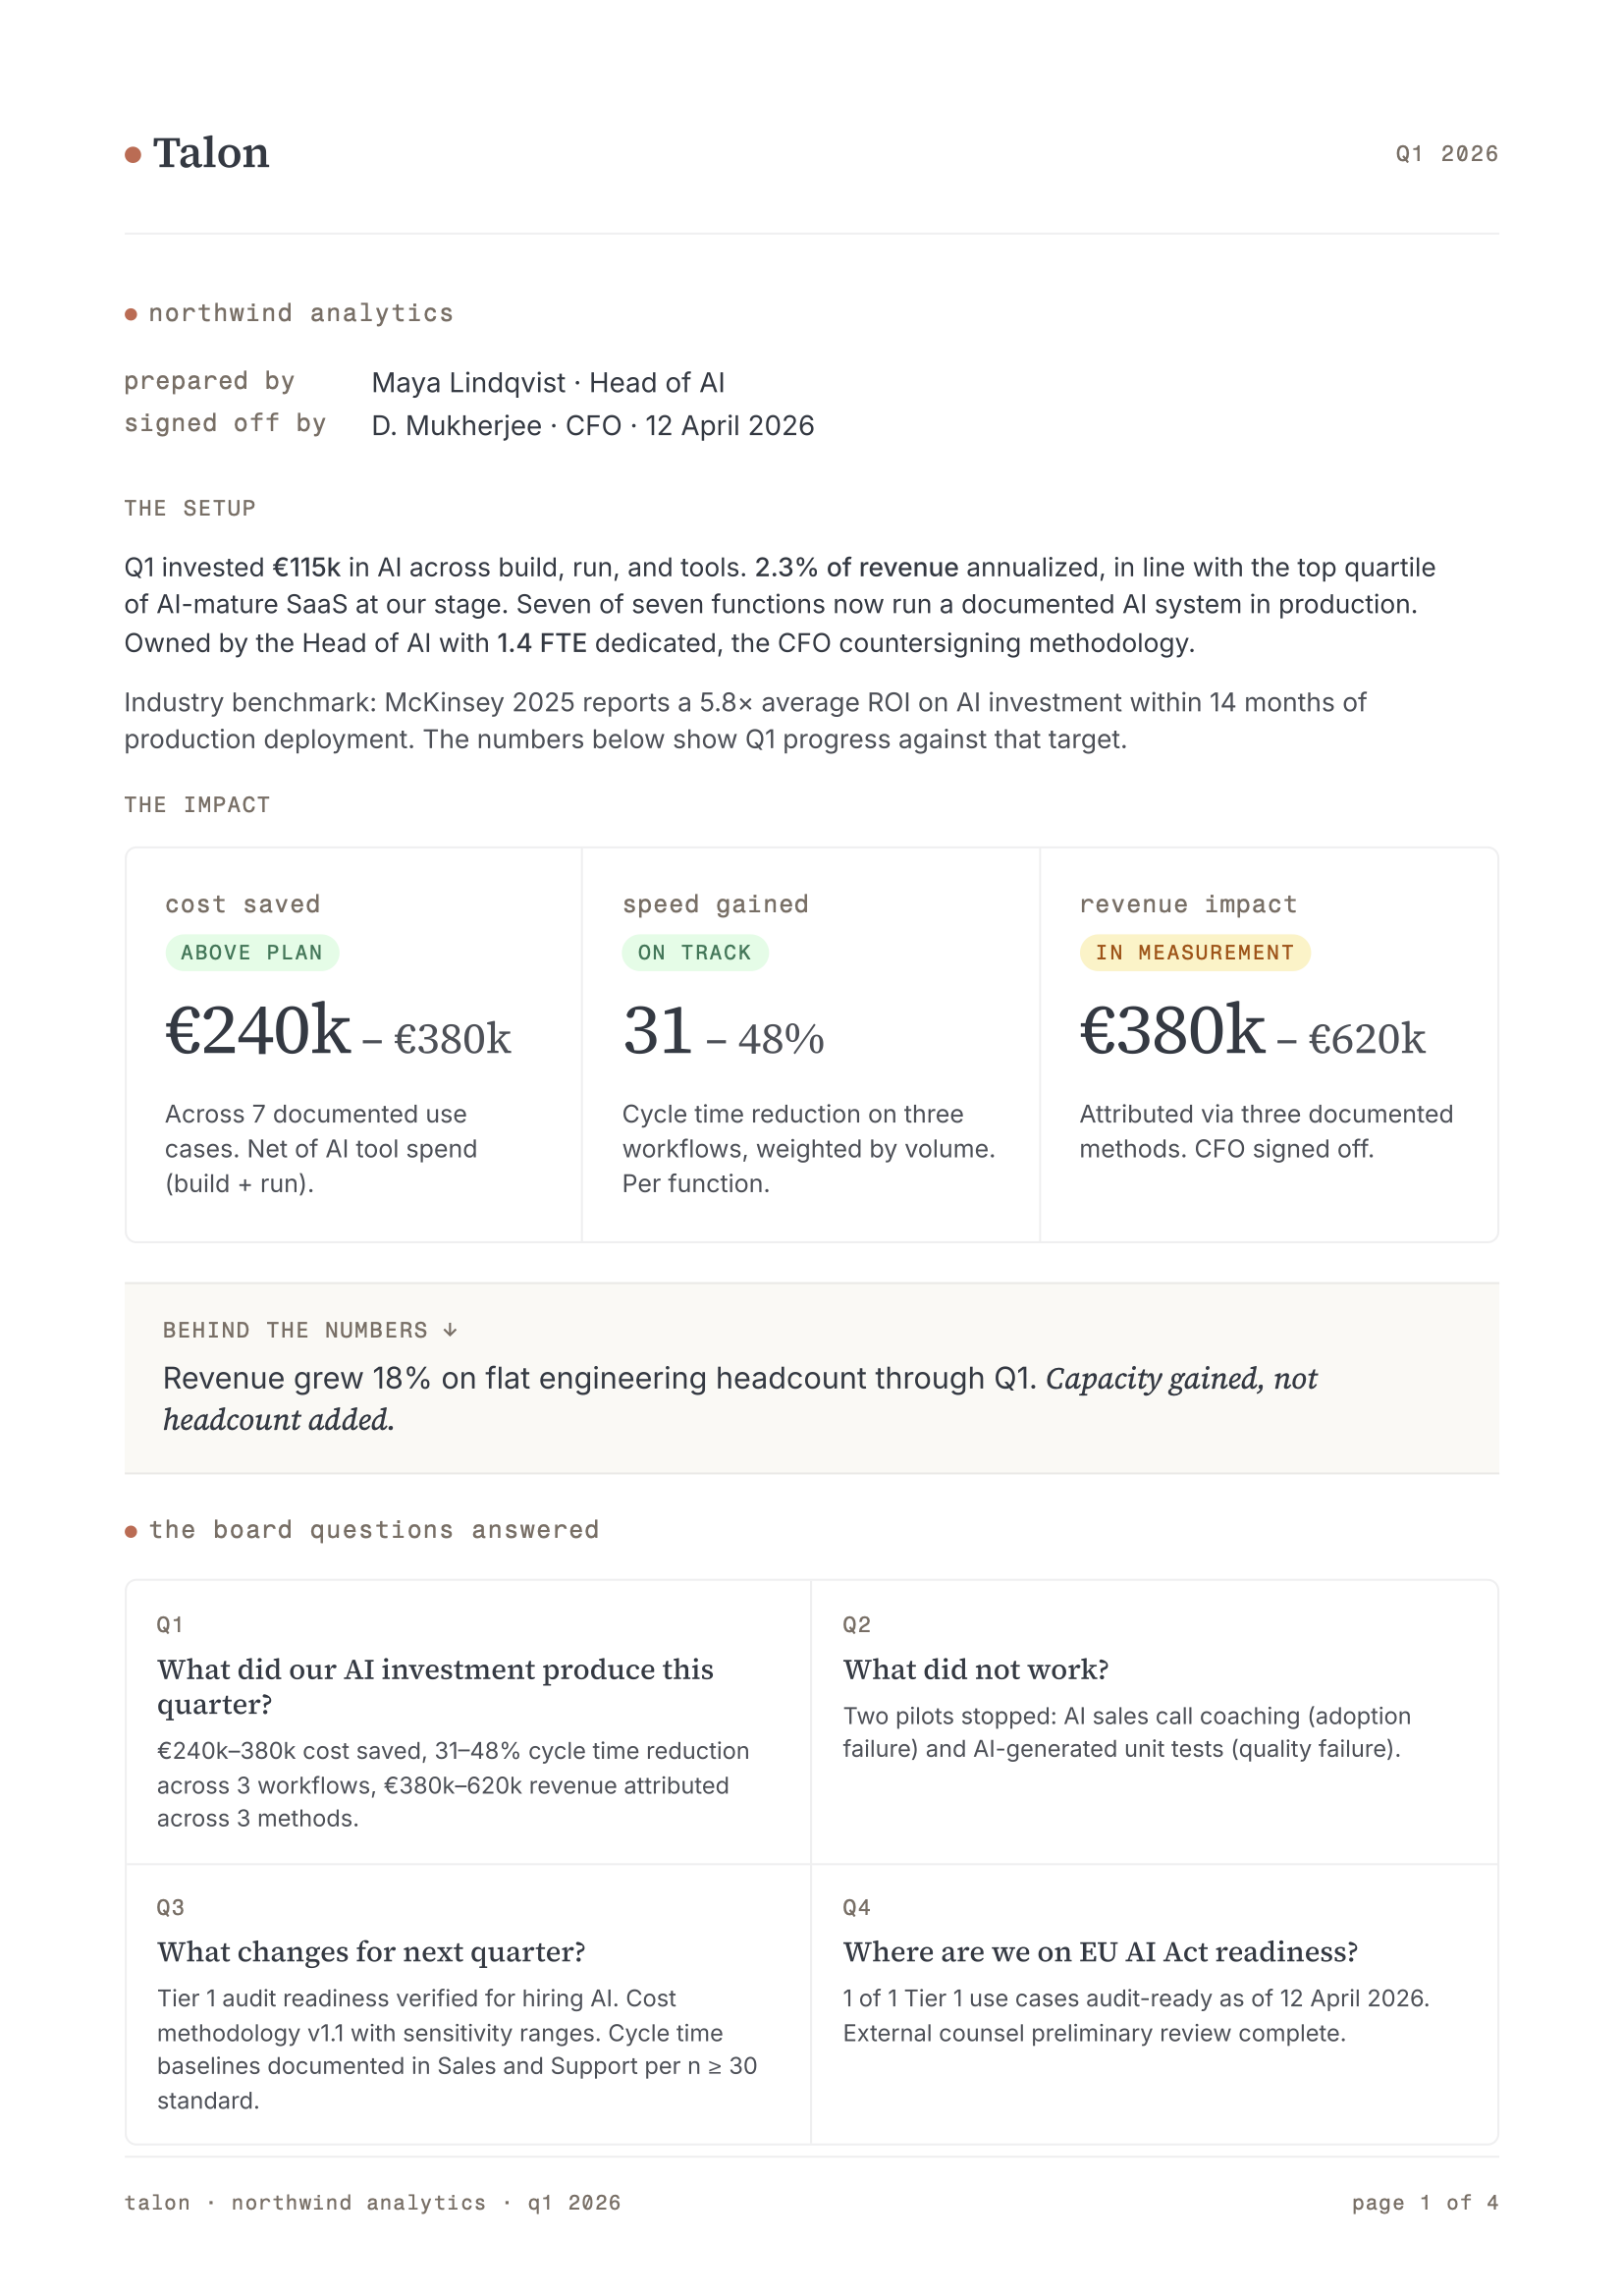
cost saved
€240k – €380k
Across 7 documented use cases. Net of AI tool spend (build + run).
above plantalon · get a grip on ai adoption
Built for the person who answers "where are we on AI?" when the board asks. Founders today. Heads of AI tomorrow. Track impact in cost, speed, revenue, and capacity gained with documented assumptions your CFO will sign off on.
Download the sample report →The methodology is open-source. AI is new. The reporting discipline is not.
the problem
Most executive teams have now sat through some kind of AI fluency assessment. The score sits in a folder. Nothing changed. Meanwhile, only 5%1 of companies are 'future-built' for AI.
Your board does not want to know your fluency level or how many seats you bought. They want financial impact. Cost saved. Speed gained. Revenue earned. In euros, with assumptions a CFO can sign off on.
Scoring is a snapshot. Activity dashboards are noise. Reporting is an operating system. Talon is the operating system.
the report
cost saved
€240k – €380k
Across 7 documented use cases. Net of AI tool spend (build + run).
above planspeed gained
31 – 48%
Cycle time reduction on three workflows, weighted by volume. Per function.
on trackrevenue impact
€380k – €620k
Attributed via three documented methods. CFO signed off.
in measurementbehind the numbers ↓
Revenue grew 18% on flat engineering headcount through Q1. Capacity gained, not headcount added.
how it works
Each one gets an owner, a use case tier (high-stakes, medium, internal productivity), a metric type, and an impact range.
Cost, speed, revenue, and capacity gained rolled up by tier, by function, by use case. Every claim has a documented assumption.
Drift, progress, killed pilots, scaled wins. Made visible to your board.
the methodology
Talon is built on the AI Adoption Playbook, an open-source framework that runs inside Claude Code. Two stages, twelve skills. Stage 1 diagnoses where AI adoption is stuck. Stage 2 measures whether you can defend the value to a board. Same methodology you see in the sample report. Use it yourself, or talk to me about helping you implement it.
View the playbook on GitHub →what talon tracks
financial impact
portfolio health
risk and governance
the sample
A four-page PDF showing what your next board update could look like. Fictional company, real methodology.